Showing posts with label Market. Show all posts

Saturday, 9 August 2014

Market Watch: STI 9Aug

Happy National Day and happy 49th birthday Singapore. Even though our achievements have surpassed many countries, we are still a young nation. At this juncture, coming to the end of the quarter, let's do a review of how STI has performed over the past 8 months compared to some of its closest partners and as well as competitors.

In the table below, I have tabulated the gain in the index of these countries over the last 8 months.


It is interesting to find:

  1. Taiwan is top among these countries
  2. Top 3 countries are all chinese related market
  3. has the flow of funds move away from Singapore into these other market
With the improvement in the PMI and investors confidence in the Chinese market, are we going to see further uptrend? And would Taiwan and Hong Kong continue to benefit and ride on the uptrend of the Chinese market. 

Saturday, 8 February 2014

Market watch: STI 8Feb

Is the selling over or is the rebound sustainable, that's the question that most of us wants to know. Although, STI has recovered a little, the 50d MA is still below the 200d MA. The weekly chart below is also showing weakness, with 10 MA trending downwards. Pivot is at 3105.

On the bright side, the party still continues with VIX below 20. If it goes above 20, one should start leaving before the party ends. :)


Sunday, 26 January 2014

World Economics Forum at Davos sets investment tones for 2014

At the annual World Economics Forum at Davos 2014, attended by head of states, economists and CEO of large MNC, this is where lots of information and data about economics were exchanged. And some of these discussions might just gave clue to the investment tone for this year.

Just to highlight some of the good reading and information complied as reference;
1. theguardian.com-five key data sets
2. www.onenewspage.co.uk - Shiller Warns of Global Bubbles
3. www.huffingtonpost.com
4. in.reuters.com-india tapering
5. www.bloomberg.com -Brazil
6. uk.reuters.com - emerging
7. forumblog.org- europes top 10 competitive economies
8. www.bloomberg.com - investors most upbeat in 5 years
9. www.cnbc.com - shiller

Tuesday, 31 December 2013

Last trading day of 2013

I was on vacation when I saw the news of layoffs by HGST and it struck deep in me as I have also heard about friends and clients whom were layoff in the financial sector since last year. This is definitely not the most desired way to end 2013 and start 2014. I hope they have a healthy balance sheet(family) to see them through during these period and that they can find employment in 2014. This further reinforced that one should prepare himself/herself financially so that in the event such a unfortunate thing happen, it is not the end of the world.


As we moved into the last trading day of 2013, I would like to share some of the lessons learnt over the last 12 months. 

Risk and Rewards. Dr Tony Tan once said, and I quote 'when you take care of the downside, the upside will take care of itself'. How wise is the statement, and many times, it has worked for me for those shares that I have bought below their NAV and low PE. Taking care of the risk also means that one needs to cut loss if it does not turn out to be in the direction that you have set out to be. Cutting loss is important as you keep your loss to the minimum so that the profits from the other counters can help to reduce the impact to your overall portfolio.

Know Thyself. Not everyone can be both a trader and an investor. My definition of a trader is one who buys and sells share based on TA, solely TA, and that he/she does not keep shares for long period of time(more than 2 to 4 weeks). An investor is one who uses FA to select the stocks that he/she wants to buy and then uses TA to time the entry and exit from the market. I know where i belong to after having my loss when I tried trading.

Diversify. Although some people said that you dont know what you are investing if you have a diversification of portfolio. I have said this many times, I am not expert so I cant be putting all my eggs into one basket(and besides most of the experts were also wrong during the Lehman crashed) and therefore I need to learn from someone who has proven track record. Walter Schloss holds a portfolio of stocks using his own selection which he has shared and for 45 years, his fund has produced a healthy return of 15.3%. This is very impressive considering that it has beaten S&P500 which has recorded 10% for the same period of time. And besides, the penny crashed that we had in October, can you imagine if you have put all your savings into one of these counter, Blumont Group Ltd, Asiasons Capital Ltd and LionGold Corp Ltd.

Be Patient. I too made this mistake of buying too early, just like most of the investors. I have to constantly remind myself that sometime it is worthwhile just to wait for a few more days before deciding again whether to enter the market. To mitigate this, for the past few counters, I have been entering that market in batches using TA.

In less than 15hrs, we will be starting 2014, what is your investment strategy moving into the new year ...


Saturday, 14 December 2013

Market Watch: STI 14 Dec 2013

It's the year end holiday season and many folks are on leaves or starting their year end break, as such, there isn't much market activities or interesting news. The only ones that is still floating around on and off is still the talk on the QE tapering. This should go on for a while, but from the look of it, it seems that the market is already absorbing some of the potential impact and is not reacting as drastically as it was initially.

Anyway, STI has started its down-trend, looking at the chart below, pivot at 3122, so we are 56 points below based on last closing. Should you be worried, I mean, if you looked at the rectangle, it just means that it's been range bound at about 200 points since June this year. 


Saturday, 26 October 2013

How to tell(simplistically) if the market is expensive?

Both Dow Jones and S&P500 has hit and continue to stay at new high, questions have been asking if one is still able to invest in this market.
One of the quick way would be to look at the CAPE ration as a quick guide to determine which market one can invest. Cyclically-adjusted price-earnings(CAPE) ratio was introduced by Graham and Dodd, latter on also used by Robert Shiller. Cambria Quantitative Research's Mebane Faber extended the used of the ratio to measure global markets. Below is a chart which shows how the world markets ranks from cheapest to expensive.
Source:businessinsider.com
From the chart, it seems that most of the European countries are fairly cheap. In the middle, we have few from Asia. At the top end, to name a few, there is the US, Indonesia and Malaysia. Malaysia came as a surprise to me though ... ...


Tuesday, 15 October 2013

Should you be worried about Oct 17 - US debt ceiling ?

Thanks to the media and internet, by now most of us know that US will run out of money this week if the Republicans and Democrats cannot reach an agreement to raise the borrowing limit coming 17 Oct. And if this happens or is going to happen, shouldnt there be a lot of fear in the market.

One of the indicator known as the 'fear' indicator, VIX(^VIX) is commonly used as a guide to determine the sentiment of the investors or the volatility of the market. Looking at the chart below, the indicator is below 20 now, meaning that there is not much of fear now, business as usual. The last time that it hits 40 was in Aug 2011 period where there were lots of news about US and Europe being in a prolong recession and also at the same time, Standard and Poor's downgraded the US credit rating.

In that case, we still have a long way to go from the current 16 to 40.

Source: Yahoo Finance

Sunday, 22 September 2013

Market watch: STI 22/9

After the meeting last week, Fed reserve will continue its bond-buying and did not taper the QE as market has expected. The "good" news send most global markets up and Dow Jones hitting new high again. 
As for our STI, it has also reacted positively and last week it has crossed the pivot value of 3130, the falling rate has slowed down as per the monthly chart below. However, long term, it is still bearish as 50MA is still trending below 200MA.

In CNBC last week, Warren Buffet said that he is having a hard time finding things to buy, does that mean anything?


Monday, 9 September 2013

Abe's 4th arrow - 2020 Olympics

Tokyo, the Japanese capital, has beaten Istanbul and Madrid, to host the 2020 Olympics. Japan's economy has been on the recovery since Abe's 3 arrows to revive it's economy. The Japanese stock market has responded strongly to these initiatives. Now by winning the 2020 Olympics, there has been market talk that this is the 4th arrow which has further boosted the Japanese confidence. In many news article today, there has been reports on the further uplift of Japan's GDP till 2020 and how the win has also raised business leaders' confidence towards the economy.

All of us know that for a stock market to be able to rally up, it has to have both Confidence and Funds, now it seems that the Japanese economy has both. How can we join the party?

There are a couple of Japanese funds that is listed in the NYSE, below is a list;

  1. Japan Equity Fund(JEQ)
  2. Japan Smaller Cap(JOF)
  3. iShares MSCI Japan Index(EWJ)
  4. WisdomTree Japan Hedge Equity(DXJ)
Click on here for a research article by Fidelity, you will find information on the annualised returns and the expense ratios for each fund.


Friday, 6 September 2013

War and the stock market

Just this week, world leaders have arrived at Saint Petersburg for the G20 summit. One of the agenda is to discuss on the Syria crisis. Global markets have corrected since the Syria crisis due to the uncertainty of whether is there going to be a war. 

While surfing aimlessly, I came across this interesting article from seeking alpha on how Mr market reacts before and after US launched the Iraqi war. One of the interesting observations in the article and also by a number of experts, market rallied when war is started. Looking at the chart below, it is quite true for the Iraqi war during 1991 and 2003.

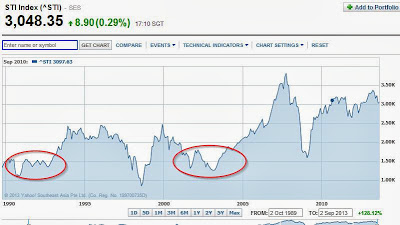
How about our STI? Let's us look at how our STI reacts to the 2 Iraq wars, dated Jan 1991 and Mar 2003.


If you look at the first Iraq war(red oval on left), the index rallied from about 1200 to more than 2300(in 1994), more than 1000 points.
The next Iraq war, the index rallied from about 1300 to 3650(2007), more than 2300 points.

What is the similarity here?  Both started off from a low base of below 1500. Looking at where STI is today, do you think history will repeat itself? If what the experts said in theory is true and history were to repeat itself, does that mean that STI will hit at least 4000 in the next few years ???